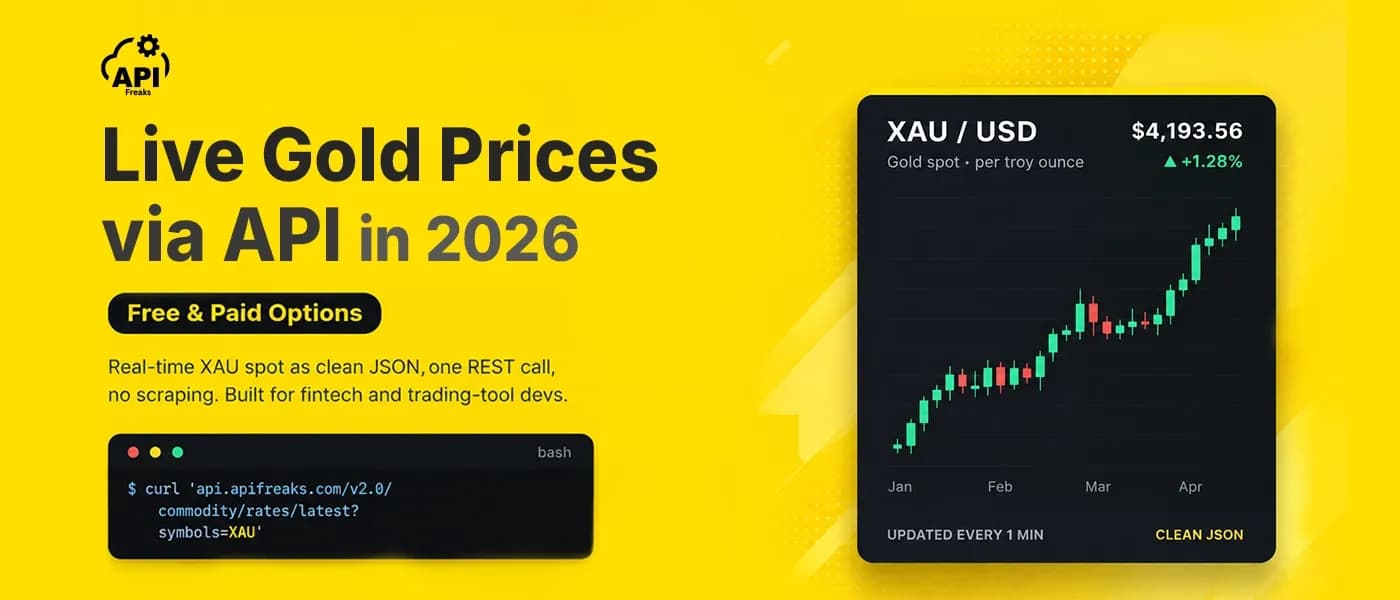

Gold set a new intraday all-time high near $5,589 an ounce on January 28, 2026, and it has kept moving fast enough since that a price you checked an hour ago can already be wrong. If you're building anything that shows, calculates, or acts on the value of gold, you need that number as structured data your code can read, not a figure copied off a chart.
This guide covers both halves of that problem. First, the genuinely free, open sources you can pull gold data from without a vendor account, and where each one runs out of road. Then a full walkthrough of getting live, per-second gold rates via API, with real code and the production details that matter once actual users load the page.
Key Takeaways
- Gold trades as
XAU, priced per troy ounce (31.1035 g) in USD by default. A per-gram price is the per-ounce price divided by 31.1035. - Two genuinely free, open sources exist for gold price data: the World Bank's Pink Sheet (CC BY 4.0, monthly averages back to 1960) and the USGS Mineral Commodity Summaries (public domain, annual averages). Both are built for research, not for a live-updating app.
- The LBMA Gold Price, the industry's twice-daily benchmark, is not free to build on. Using or redistributing it, including for valuation, requires a paid usage licence from ICE Benchmark Administration (IBA).
- For a live number your code can poll, the APIFreaks Live Commodity Prices API gives 10,000 free signup credits, no credit card required, enough for roughly 277 gold calls before you need to top up.
- Cache whatever you fetch. Calling a metered API once per page load is the most expensive mistake you can make; fetch on a schedule and serve everyone the cached value.
- Check the terms of service for what your specific use case is permitted to do with the data. Free and open aren't the same license, and neither one automatically covers redistribution.
What a Gold Price API Actually Returns
A gold price API is a web service that returns the current price of gold as structured data, almost always JSON over HTTPS, so your application can read the number directly instead of scraping it off a page. You send one HTTP request and get back a machine-readable price you can parse in a single line: no HTML, no fragile CSS selectors, no scraper to maintain when a site redesigns.
Two things to know before you pick a source:
The symbol is XAU. Gold uses the ISO 4217 code XAU: "X" marks a non-currency commodity, "AU" is the chemical symbol for gold. XAU/USD means gold priced in US dollars. Because it's a standard ISO code, most finance libraries and databases handle it the same way they handle any currency pair.
The unit is the troy ounce. Gold is priced per troy ounce, which is 31.1035 grams, about 10% heavier than the everyday avoirdupois ounce (28.35 g). To get a per-gram price, divide the per-ounce figure by 31.1035. A source that states its unit explicitly (troy ounce vs. gram vs. kilo) saves you from a silent unit mismatch, which is an easy way to be off by a factor of 31 without any error being thrown.
Developers reaching for gold price data are typically building one of a few things: a trading dashboard that plots XAU/USD live, a portfolio tool that values a client's bullion holdings alongside stocks and cash, a jewelry or bullion pricing calculator, a threshold alert that fires when gold crosses a level, or a research pipeline that needs a defensible historical series. The right source depends heavily on which of those you're doing, which is why this guide splits into free research-grade data and paid live data rather than treating them as competing options.
Free, Open Gold Price Data (For Research, Not Live Apps)
If you're doing analysis, building a report, or need a historical baseline rather than a live number, there are genuinely free, openly licensed sources with no signup and no API key.
World Bank Commodity Price Data (the Pink Sheet)
The World Bank publishes monthly commodity prices going back to January 1960 for around 70 commodities, gold included, under the name "Commodity Price Data" or, informally, the Pink Sheet. It's released as a downloadable Excel workbook rather than a REST endpoint, updated on the second business day of each month, and the World Bank's own data catalog lists it under a Creative Commons Attribution 4.0 license, meaning you can use and redistribute it as long as you credit the source.
The gold series in the workbook is a monthly average, not a tick-by-tick feed. Because it's a plain xlsx file at a stable URL, you can pull it straight into a script:
import pandas as pd

URL = ("https://thedocs.worldbank.org/en/doc/"
       "74e8be41ceb20fa0da750cda2f6b9e4e-0050012026/related/"
       "CMO-Historical-Data-Monthly.xlsx")

df = pd.read_excel(URL, sheet_name="Monthly Prices", header=4, skiprows=[5])
gold = df[[df.columns[0], "Gold"]].rename(columns={df.columns[0]: "month"})
gold = gold[pd.to_numeric(gold["Gold"], errors="coerce").notna()]

print(gold.tail(3).to_string(index=False))
# month     Gold
# 2026M06   4228
# 2026M07   4073
# 2026M08   4411
That's a real pull against the live file, run while writing this guide. Note that the World Bank periodically rotates the document ID in that URL when it publishes a new monthly release, so a production script should scrape the current link from the Commodity Markets page rather than hardcoding it indefinitely.
USGS Mineral Commodity Summaries
The U.S. Geological Survey publishes an annual Mineral Commodity Summaries report covering gold alongside around 90 other minerals, with a chapter giving the domestic annual average price per troy ounce. The 2026 edition lists the 2025 figure as an estimate ("2025e") at $3,300 an ounce, since the report is compiled before the year's final data is in. The data is public domain (per the USGS data release's own licensing statement) and ships as a structured data release alongside the PDF, updated annually.
This is annual, US-focused, and backward-looking by design. It's the right source if you need a defensible reference figure for a report or a supply-and-demand narrative, not for anything that needs to move during the day.
Why the LBMA Benchmark Isn't a Free Option
The LBMA Gold Price is the reference most of the industry actually means when it says "the gold price": a benchmark set twice daily, at 10:30 and 15:00 London time, through an electronic auction administered by ICE Benchmark Administration. It's the number that gets cited in news coverage and used for contract settlement, and it isn't the same number as the intraday spot price a chart or ticker shows you. Gold's intraday spot price set its all-time high near $5,589 on January 28, 2026. The LBMA Gold Price's own record came the next morning: $5,501.70 on January 29 (a.m.), per LBMA's own Q2 2026 market report. Different instrument, different day, different number, which is exactly the kind of gap that matters if you're citing "the gold price" in a report or building something that needs to match a specific reference.
It's easy to assume that because it's referenced everywhere, it's free to build on. It isn't. Per IBA's own published terms, any party using the LBMA Gold Price for valuation or pricing activities, or in transactions and financial products, requires a paid usage licence directly with IBA. That requirement covers real-time, intraday, and even delayed data. The World Gold Council removed its historical LBMA Gold Price archive from its own site in March 2025 at IBA's request, which is a fairly direct signal of how seriously that licensing boundary is enforced.
You can read about how the auction works and who administers it on the LBMA's own site, as a human reading a page, but LBMA only publishes the latest auction price on its homepage a working day later. Since November 2025 its historical price tables sit behind a licensed Members' Portal, and actually using the underlying data is a different, licensed thing.
Free Sources at a Glance
| Source | Update frequency | License | Best for |
|---|---|---|---|
| World Bank Pink Sheet | Monthly | CC BY 4.0 | Long-run historical analysis, research reports |
| USGS Mineral Commodity Summaries | Annual | Public domain | Yearly reference figures, supply/demand context |
| LBMA Gold Price | Twice daily | Requires paid IBA licence | Not a free option for products |
The gap between all three of these and a live app isn't really about price, it's about cadence. A monthly average or an annual figure tells you where gold has been. It can't tell you what it's worth right now, and none of them are built to be polled by code on a schedule the way a REST API is.
Live Gold Prices via API
Once you need a number that updates during the trading day and that your code can fetch on demand, you're looking at a proper API rather than a downloadable file. The APIFreaks Live Commodity Prices API covers gold as one of 245+ supported commodity symbols, alongside silver, oil, and a broad agricultural and industrial catalog, all behind a single endpoint and a single credit pool.
Signup gives you 10,000 free credits with no credit card required. A live call costs 35 credits as a base fee plus 1 credit per symbol requested, so a single-symbol XAU call runs 36 credits total (35 + 1), which works out to roughly 277 calls from the free allocation. Credits are only charged on a successful (2xx) response; anything that fails is refunded automatically, so testing and debugging don't burn through your balance.
A live call to the endpoint, run on 21 September 2026, returned:
{
  "success": true,
  "timestamp": 1789975792,
  "rates": { "XAU": 4347.96 },
  "metadata": { "XAU": { "unit": "T.oz", "quote": "USD" } }
}
That's everything an integration needs: the price (rates.XAU), when it was captured (timestamp), and how to read it (unit and quote). Per the API's own Commodity Symbols reference, gold is listed with an updateInterval of PER_SECOND, the same live-feed cadence as silver, so there's no separate "fast" tier to opt into for this particular commodity.
Python
import requests

url = "https://api.apifreaks.com/v2.0/commodity/rates/latest"
params = {"symbols": "XAU", "quote": "USD"}
headers = {"X-apiKey": "YOUR_API_KEY"}

resp = requests.get(url, params=params, headers=headers, timeout=10)
resp.raise_for_status()
data = resp.json()

xau = data["rates"]["XAU"]
unit = data["metadata"]["XAU"]["unit"]  # "T.oz"
print(f"Gold: {xau:,.2f} USD per {unit}")
# -> Gold: 4,347.96 USD per T.oz
Since credits are only deducted on success, a failed call won't cost you anything, but still handle errors so a network blip doesn't crash the app:
try:
    resp = requests.get(url, params=params, headers=headers, timeout=10)
    resp.raise_for_status()
    data = resp.json()
    price = data["rates"]["XAU"]
except (requests.RequestException, KeyError) as e:
    print(f"Could not fetch gold price: {e}")
    price = None
JavaScript
const url = new URL("https://api.apifreaks.com/v2.0/commodity/rates/latest");
url.search = new URLSearchParams({ symbols: "XAU", quote: "USD" });

const res = await fetch(url, { headers: { "X-apiKey": "YOUR_API_KEY" } });
if (!res.ok) throw new Error(`HTTP ${res.status}`);
const data = await res.json();

console.log(`Gold: ${data.rates.XAU.toLocaleString()} ${data.metadata.XAU.quote}`);
// Gold: 4,347.96 USD
One security note that's easy to skip: never expose your API key in front-end code. For a browser app, proxy the request through a small backend or serverless function that attaches the X-apiKey header server-side, and keep the key in an environment variable.
Cache It Instead of Polling on Every Page Load
The most expensive mistake with a metered gold API is calling it once per user request. If 500 people load your dashboard in a minute, that's 500 identical calls for a number that changed, at most, once. Fetch on a schedule and serve everyone the cached value:
import time, requests

_cache = {"price": None, "ts": 0}
TTL = 60  # seconds; tune to what your UI actually needs

def get_gold_cached():
    now = time.time()
    if _cache["price"] is None or now - _cache["ts"] > TTL:
        try:
            r = requests.get(url, params=params, headers=headers, timeout=10)
            r.raise_for_status()
            _cache["price"] = r.json()["rates"]["XAU"]
            _cache["ts"] = now
        except requests.RequestException:
            pass  # timeout, connection error, or bad status: reuse last good value
    return _cache["price"]
Falling back to the last good value on a failed call matters here. requests.get raises an exception on a timeout or dropped connection rather than returning a response object, so the fallback has to live inside a try/except, not just an if not r.ok check. When you hit a plan's credit limit or the network hiccups, serving a slightly stale price is almost always better than erroring the whole UI out.
Handle Closed Markets
Gold doesn't trade continuously. On the days and hours when the market is closed, a "live" endpoint keeps returning the last tick it has, unchanged, which is correct behavior, not a bug, but it will look wrong to a user if your UI still shows a green "live" indicator next to it. The response's timestamp field records when the response was generated, not when gold last traded, so it can't tell you whether the market is open. Check the day of the week instead of assuming every response reflects a live trade:
import datetime

now = datetime.datetime.now(datetime.timezone.utc)
if now.weekday() == 5:
    status = "market closed"  # Saturday
else:
    status = "live"  # gold resumes trading Sunday evening depending on region;
                      # treat this as approximate and confirm against a trading calendar
                      # if your app needs an exact reopen time
An unchanged price over a closed period isn't a failed call, it's the market being shut. Don't build monitoring that alerts on "gold hasn't moved in several hours" without accounting for that.
Partial Content and Batched Symbols
You can request multiple symbols in one call with a comma-separated symbols parameter, which is how you'd pull gold and silver together instead of running two requests. If you mix valid and invalid symbols, the API returns a 206 Partial Content response: the valid symbols come back normally under rates, and the invalid ones are listed separately under unresolved with a message, at no credit cost for the symbols that didn't resolve.
{
  "success": true,
  "timestamp": 1789386952,
  "rates": { "XAU": 4287.98 },
  "metadata": { "XAU": { "unit": "T.oz", "quote": "USD" } },
  "unresolved": {
    "INVALID": { "message": "We don't support this symbol, please visit our symbols page to see supported symbols." }
  }
}
Treat 206 as a normal, expected response shape in your integration, not an error path.
Currency, Grams, and Karats
Pass a quote parameter to get XAU priced in a currency other than USD:
params = {"symbols": "XAU", "quote": "EUR"}
# rates.XAU is now XAU priced in EUR per troy ounce
For a jewelry or bullion tool, convert to a per-gram figure with the troy-ounce constant, then apply purity. Karat is a fraction of 24: 24k is pure gold, 18k is 18/24 (75%), 14k is 14/24 (58.3%). Using the live price from earlier in this guide as an input, here's the melt value of a 10-gram 18k ring:
TROY_OZ_IN_GRAMS = 31.1035

per_oz   = 4347.96                   # USD per troy ounce
per_gram = per_oz / TROY_OZ_IN_GRAMS # 139.79 USD/g (24k)
melt_18k = per_gram * (18 / 24)      # 104.84 USD/g
ring     = melt_18k * 10             # 1,048.43 USD melt value
retail   = ring * 1.35               # + 35% margin -> 1,415.37
That's a functioning pricing engine from one API call, the same logic behind bullion product pages and jewelry configurators.
Scaling Up: Paid Plans
Two signs tell you it's time to move past the free allocation: you've spent the one-time 10,000 signup credits, which don't expire but also don't refill, or your polling schedule uses credits steadily enough that a monthly plan's lower per-credit price beats topping up one-off packs. Commodity Prices isn't one of the endpoints APIFreaks throttles by concurrent request count, so what actually limits you here is credits, not request rate. On the 80K monthly plan and all one-off packs, running out returns 402 Payment Required until you add credits; on 600K-credit plans and above, exceeding your allowance draws from a surcharge pool at a per-plan rate instead of blocking requests, up to that plan's surcharge limit.
| Plan | Price/month | Credits | Approx. gold calls (36 credits/call) |
|---|---|---|---|
| 80K Credits | $10 | 80,000 | ~2,222 |
| 600K Credits | $50 | 600,000 | ~16,666 |
| 1.5M Credits | $100 | 1,500,000 | ~41,666 |
| 4.5M Credits | $250 | 4,500,000 | ~125,000 |
| 10M Credits | $500 | 10,000,000 | ~277,777 |
| 17M Credits | $800 | 17,000,000 | ~472,222 |
Yearly billing runs at 10 times the monthly price rather than 12, which is roughly a 17% discount over paying monthly for a year, though yearly-plan credits still reset every 30 days rather than accumulating across the year. Monthly subscription credits also expire after 30 days rather than rolling over. One-off credit packs come in the same tiers (80K for $20 up to 17M for $1,600) and never expire, but they cost roughly twice as much per credit as the matching monthly plan. That trade-off is the right one for irregular or bursty usage; a steady polling schedule is cheaper on a subscription.
Every plan draws from the same credit pool and hits the same endpoints. Gold, silver, oil, and the rest of the 245+ commodity catalog, plus currency conversion, all run through one API key, so moving to a paid plan is a matter of buying more credits rather than re-integrating against a different tier of the product.
What You Can Build With This
The endpoints above map directly to what developers actually ship in this space:
- A live ticker or dashboard. Poll the latest endpoint on a schedule (with the cache pattern above) and render the current price.
- Change-over-time tracking. Store each cached reading in your own table, or backfill daily history back to 1990 with the Historical Commodity Prices API.
- Threshold notifications. Compare the latest price to a user's target and fire a webhook or email when it's crossed.
- A jewelry or melt-value calculator. Multiply the per-gram price by weight and karat fraction, as shown above.
- Portfolio valuation. Multiply a user's gold holdings by the live XAU price in their reporting currency.
Because gold is one symbol among 245+, the same integration pattern extends to silver (XAG), platinum, oil, and the rest of the catalog without adding a second vendor.
A Compliance Note for Fintech Builders
If you're building for fintech or trading, keep one distinction in mind above everything else in this guide: reference-rate data is for information, not execution. Gold price data, whether from a free research source or a live commodity API, is published for valuation, display, and analytics, not as a tradable quote you can fill an order against. If you're building anything that touches real orders or regulated advice, get executable quotes from your broker or exchange feed, and treat any third-party price as a display and valuation input.
Also read the terms on data redistribution before you build with any source in this guide, free or paid. Showing a price inside your own app and re-selling or bulk-redistributing a feed are typically treated very differently, and that distinction is usually where a license gets violated without anyone intending to.
Conclusion
Choosing how to get a gold price in 2026 comes down to matching the source to the job. The World Bank's Pink Sheet and the USGS Mineral Commodity Summaries are genuinely free, openly licensed, and well-suited to research and historical analysis, but they update monthly or yearly, not live. The LBMA benchmark looks free because it's everywhere in the news, but it requires a paid licence the moment you build on it. For anything that needs a number that moves during the day, whether that's a dashboard, a pricing calculator, or a portfolio tool, you need a live API, and gold's per-second update cadence on APIFreaks' commodity catalog means the free 10,000-credit signup is enough to build and test a full integration before you need to spend anything.
Start pulling live gold prices with 10,000 free credits. The Live Commodity Prices API requires no credit card to get started. Create a free account and make your first call in minutes.
FAQ
Is there a genuinely free way to get gold price data?
Yes, for research and historical use. The World Bank's Pink Sheet (monthly, back to 1960, CC BY 4.0) and the USGS Mineral Commodity Summaries (annual, public domain) are both free and openly licensed. Neither is a live feed. For a number that updates during the trading day, the APIFreaks Live Commodity Prices API gives 10,000 free signup credits with no credit card required.
Is the LBMA Gold Price free to use?
No. Viewing the published benchmark on the LBMA's own site is free, but using or redistributing the LBMA Gold Price, including for valuation and pricing activities, requires a paid usage licence directly with ICE Benchmark Administration.
What does XAU mean?
XAU is the ISO 4217 code for gold. XAU/USD means gold priced in US dollars, typically requested with a symbols=XAU parameter.
Can I get gold prices in EUR, GBP, or other currencies?
Yes, on the APIFreaks Live Commodity Prices API pass the quote parameter (for example quote=EUR) and the response prices XAU in that currency instead of USD.
How often does the live gold price update?
Per the APIFreaks Commodity Symbols reference, gold's updateInterval is documented as PER_SECOND, the fastest cadence in the commodity catalog, on every plan including the free signup credits.